Lineage: Narrows the 152-test predecessor to one variant per signal, with no month-end fallback, under the recomputed 11.9907% benchmark.
The premise
Both strategies rest on the same proposition that underlies most dip-buying: weakness produces cheaper units, and cheaper units compound better. What separates them is the timeframe over which weakness is measured. One measures the fall inside a single session, from that day's open down to its low. The other measures the fall between sessions, from the prior close to the next open.
The predecessor study tested this idea 152 ways and found no winner. This study narrows the question. It takes one clean variant of each signal, drops the month-end fallback that muddied the earlier result, and runs both under a recomputed benchmark, so that the two signals can be compared against each other rather than only against the SIP.
How the strategies work
Intraday dip fires when the fall from the day's open to the day's low, expressed as a fraction of the open, reaches the threshold. Because the session low is only knowable once the day has ended, execution happens at the next morning's open. This is Strategy 1 in the platform's own numbering.
Overnight gap-down fires when the fall from the prior close to that day's open, as a fraction of the prior close, reaches the threshold. That reading is visible at the opening print itself, so execution happens on the same bar. This is Strategy 3.
Each signal runs across nineteen thresholds: 0.0%, then 0.6% to 4.0% in 0.2% steps. The 0.2% and 0.4% levels are absent from the published ladder and are not tested here.
The setup
A bank account receives ₹10,000 on the first trading day of each month, compounding at 5% annualised on actual calendar days. When a signal fires, the entire available balance deploys after a 0.03% transaction cost. Every unit bought is held permanently. There is no selling, no rebalancing and no capital gains tax anywhere in this test, because no gain is ever realised.
The benchmark is a monthly SIP, ₹10,000 on the first trading day of each month at the same 0.03% cost, no bank and no timing, on Nifty 50 daily data: 11.9907% XIRR.
What happened: intraday dips
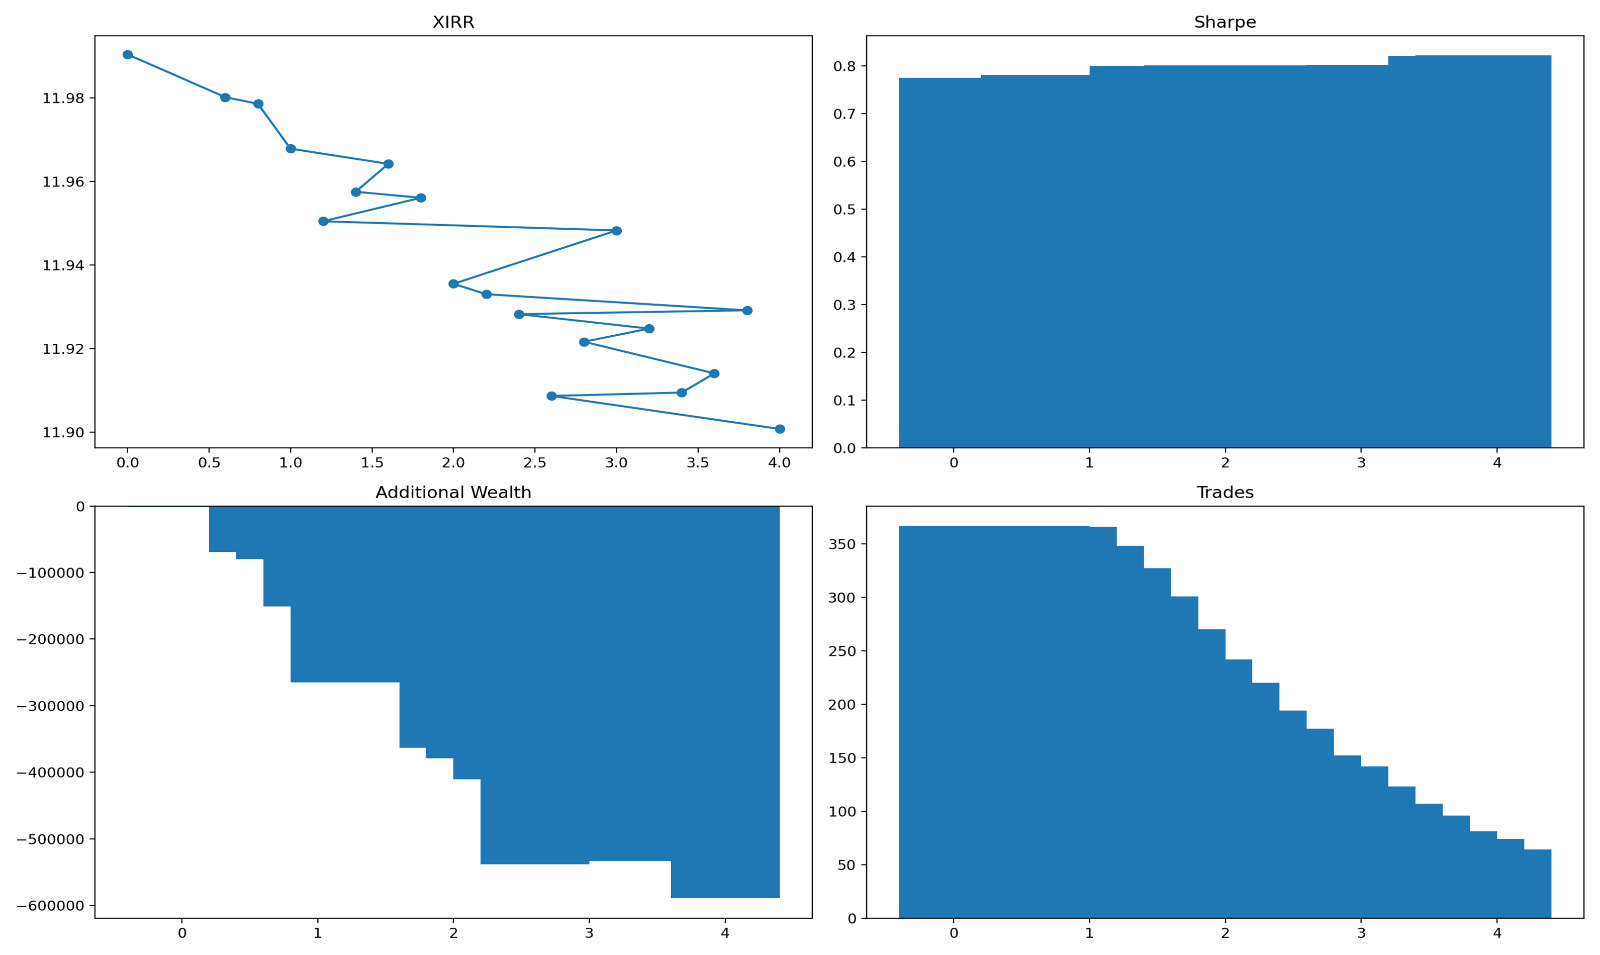
At a 0% threshold every trading day triggers a signal, but because the full bank deploys on the first trigger of the month, the strategy collapses to roughly one trade a month and reproduces the SIP's own structure. It returns 11.9905% against the benchmark's 11.9907%, a final-wealth gap of ₹1,672. The gap is that small precisely because almost no timing is happening.
Raising the threshold widens it monotonically. At 1.0% the strategy trails by ₹1.51 lakh. At 4.0% it trails by ₹5.89 lakh, with ₹2.40 lakh still sitting in the bank at period end, having earned 5% while the index compounded near 12%.
Trade count falls from 367 at 0% to 64 at 4.0%. Sharpe improves across that range, from 0.776 to 0.823, because fewer trades produce a smoother return series, but the smoothing is cosmetic: MOIC falls from 8.89x to 8.73x over the same stretch. A large open-to-low fall during a session carries no information about the next morning's open, so selectivity buys nothing except delay.
What happened: overnight gap-downs
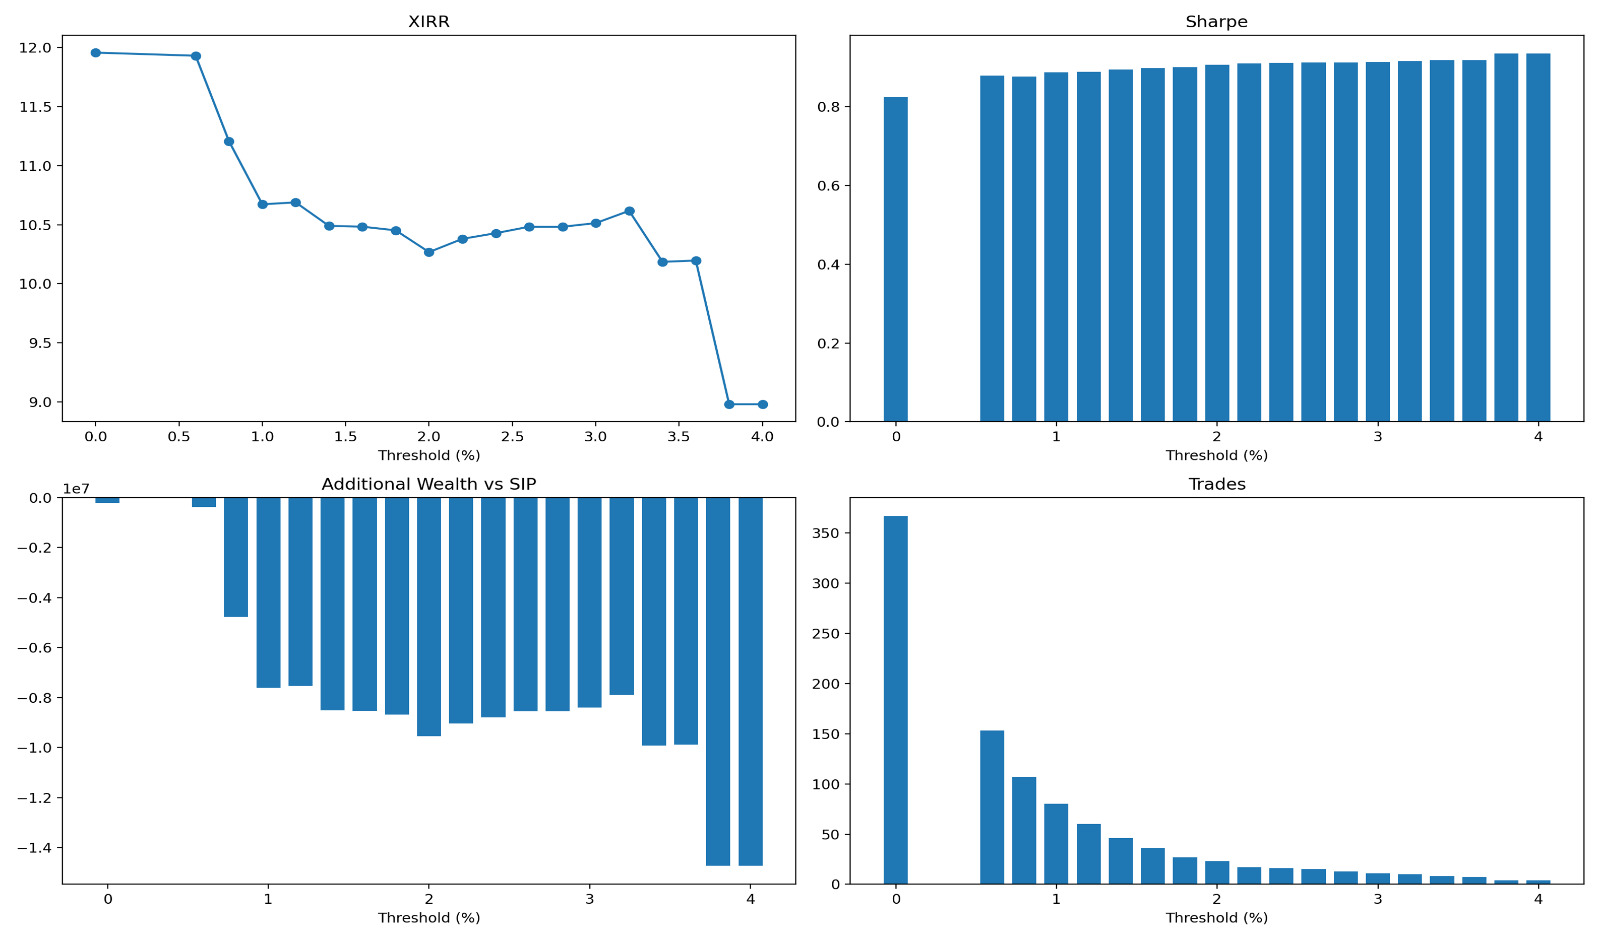
All nineteen gap-down thresholds also underperform, but the deterioration is faster and far deeper. At a 0% threshold XIRR is 11.957% against 11.991%, trailing by ₹2.21 lakh. At 0.6% the gap is ₹3.91 lakh. Between 0.6% and 0.8%, a single 0.2% step, XIRR falls from 11.93% to 11.21% and the wealth gap jumps to ₹47.8 lakh.
| Threshold | Trailing the SIP by | Note |
|---|---|---|
| 0.6% | ₹3.91 lakh | last gradual step |
| 0.8% | ₹47.8 lakh | the cliff |
| 1.0% | ₹76.1 lakh | still falling |
| 3.8% to 4.0% | ₹1.47 crore | four trades, identical outcome |
Beyond 0.8% the results never recover. At 2.0% the gap is ₹95.5 lakh. At 3.8% and 4.0% XIRR settles at 8.98%, trailing by ₹1.47 crore, roughly four times the total capital contributed. Both of those thresholds produce identical figures because the signal has become so rare that the outcome is decided by the specific dates of four trades rather than by any systematic property.
What the threshold does
Threshold moves in one direction on both signals: greater selectivity costs more. The asymmetry between the two is the finding worth carrying forward. At the extremes, choosing the gap-down threshold badly is roughly 25 times more expensive than choosing the intraday threshold badly, ₹1.47 crore against ₹5.89 lakh.
That asymmetry has a mechanical cause. A gap-down of 0.8% or more on Nifty is usually a response to a real overnight event: a global sell-off, a geopolitical shock, a policy surprise. Buying into those opens does not capture a discount, it captures the beginning of a drawdown. The same-bar execution that makes the gap-down rule faster than the intraday rule is what makes it worse, because it places the buyer first into confirmed overnight weakness with no session between signal and trade.
Where it fails
Neither signal has a winning configuration, so there is no trade-off between drawdown and reward to discuss. What a would-be implementer has to accept is simpler. Any threshold tight enough to feel like genuine selectivity, above roughly 1% for gap-down or 2% for intraday, costs real money against a plain SIP, and the cost grows with the selectivity rather than shrinking.
The underlying reason is common to both. Daily price weakness does not predict recovery at the next bar, and on an index that trends upward across most multi-decade windows, every month spent waiting is charged at the spread between a 5% bank and a roughly 12% index. The gap-down version fails harder because its signal carries more negative information: a price that opens below the prior close has already moved against the buyer before the trade is placed, while an intraday low is frequently noise inside an otherwise ordinary session.
Verdict
Across this window, the SIP beat every tested threshold on both signals, 38 of 38. Intraday dip-buying cost up to ₹5.89 lakh and overnight gap-down buying up to ₹1.47 crore, and in both sweeps the loss grew as the entry criteria tightened. Nothing in these 38 results suggests a threshold that was simply not tried. The instinct to buy a single day's weakness on this index, measured either way, was expensive rather than clever. Run the SIP.
Appendix: assumptions and methodology
- Data. Nifty 50 daily open, high, low and close over a period exceeding thirty years, price return only. These are the platform's Strategy 1 and Strategy 3.
- Benchmark. Monthly SIP, ₹10,000 on the first trading day of each month, 0.03% cost, no bank and no signal: 11.9907% XIRR.
- Bank. ₹10,000 credited monthly, compounding at 5% annualised until a signal triggers full deployment.
- Tax. None modelled, and none applies. Units are bought and held permanently, so no gain is ever realised.
- Signal definitions. Intraday dip fires when the day's open minus the day's low, divided by the open, reaches the threshold, executed at the next day's open. Overnight gap-down fires when the prior close minus that day's open, divided by the prior close, reaches the threshold, executed at that same open.
- Thresholds. 0.0%, then 0.6% to 4.0% in 0.2% steps, nineteen levels per signal. The 0.2% and 0.4% levels are not tested.
- Metrics. XIRR on dated flows. Sharpe and MOIC are reported for the intraday-dip sweep only, 0.776 to 0.823 and 8.89x to 8.73x across its threshold range.
- Not modelled. Split-period figures, year-by-year returns, brokerage beyond 0.03%, slippage, dividend reinvestment. None of these appear in the source workbooks.
- Not tested. A Nifty 500 version of either signal, and any fallback deployment rule. The predecessor study tested the fallback; this one deliberately does not.
- Withheld. Nothing. Both signal definitions and the full threshold ladder are stated above, because a single-day weakness rule has no configuration worth protecting once every level in the sweep has lost.
Comments
Questions and notes