Lineage: The mirror of the weakness study: same grid, same benchmark, opposite signal direction, and the first study in the series to find any winners.
The premise
This is the inverse of dip-buying. A market that is rising intraday, or has already gapped up overnight, offers confirmed positive price action rather than a decline that may still be in progress. Momentum also has broad academic support across asset classes and long horizons, which dip-buying does not.
What this study tests is narrower than the academic claim: whether that support survives at daily resolution, on one index, when used to time the deployment of a monthly contribution. A twelve-month momentum effect measured across a cross-section of stocks and a one-day breakout used to pick a buy date are different phenomena, and the grid is built to find out whether the second inherits anything from the first.
How the strategies work
The two signals differ by one day of information.
Overnight gap-up fires when the rise from the prior close to that day's open, as a fraction of the prior close, reaches the threshold. That reading is visible at the opening print, so execution happens on the same bar. This is Strategy 4 in the platform's own numbering.
Intraday breakout fires when the rise from the day's open to the day's high, as a fraction of the open, reaches the threshold. Because the session high is known only after the close, execution happens at the next morning's open. This is Strategy 2.
Each runs across nineteen thresholds: 0.0%, then 0.6% to 4.0% in 0.2% steps. The 0.2% and 0.4% levels are absent from the published ladder and were not tested.
The setup
A bank account receives ₹10,000 on the first trading day of each month, compounding at 5% annualised on actual calendar days. When a signal fires, the entire balance is deployed after a 0.03% transaction cost. Every unit is held permanently, with no selling, no rebalancing and no capital gains tax, because no gain is ever realised.
The benchmark is a capital-matched monthly SIP on the same Nifty 50 data: ₹10,000 on the first trading day of each month at 0.03% cost, 11.9907% XIRR, and a total gain of roughly ₹2.9 crore on ₹36.7 lakh contributed.
The best combinations
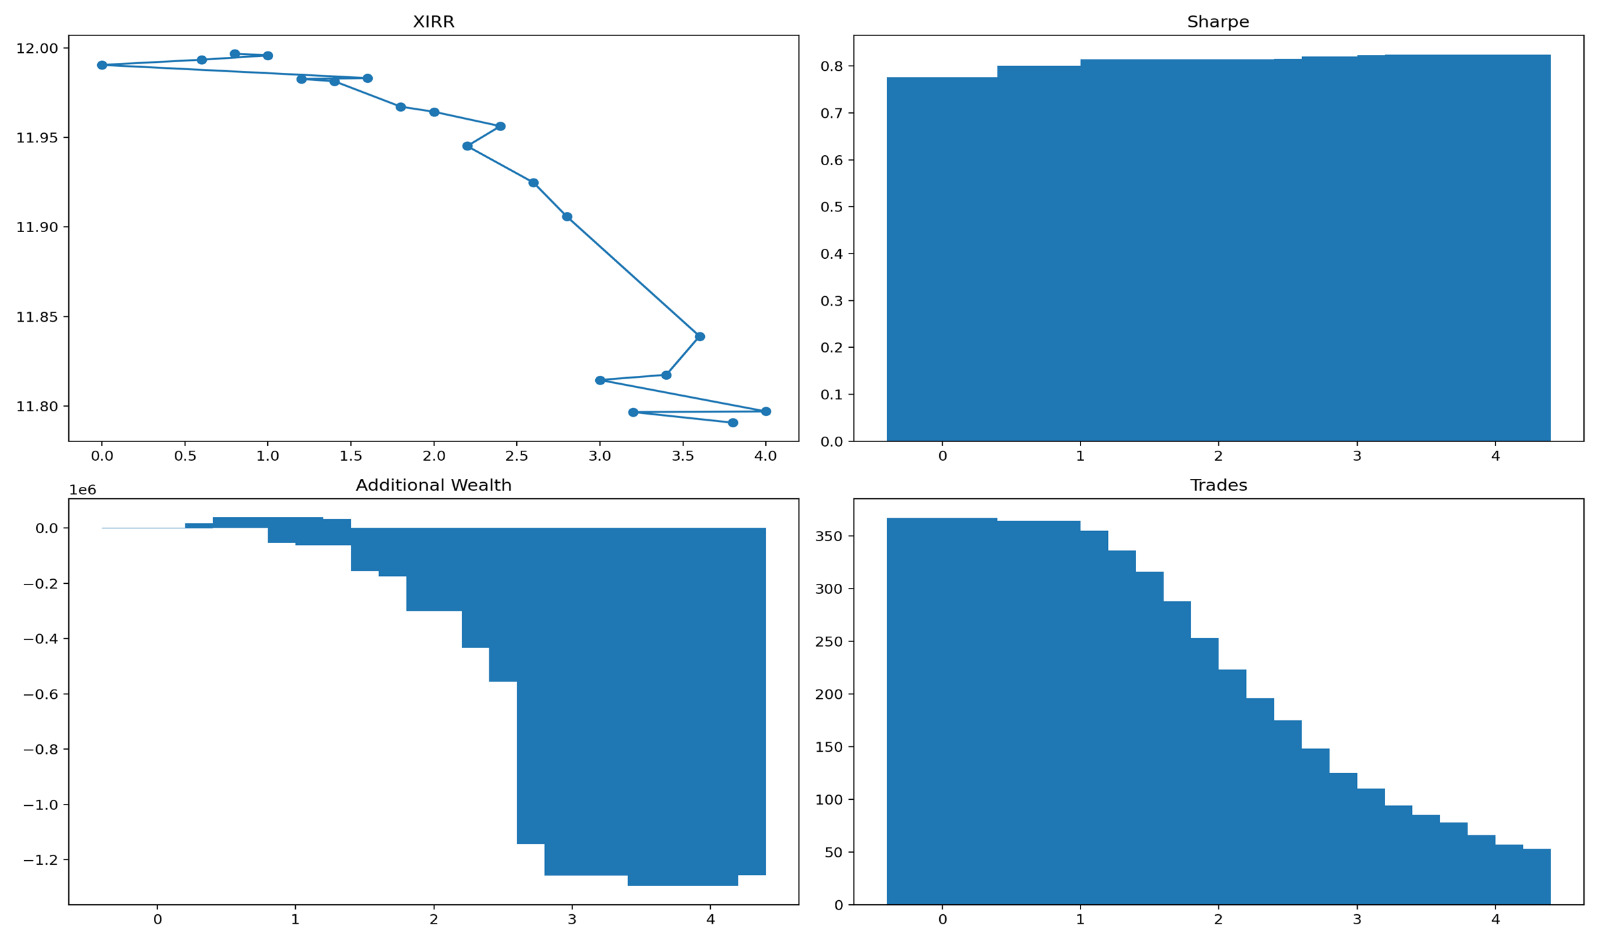
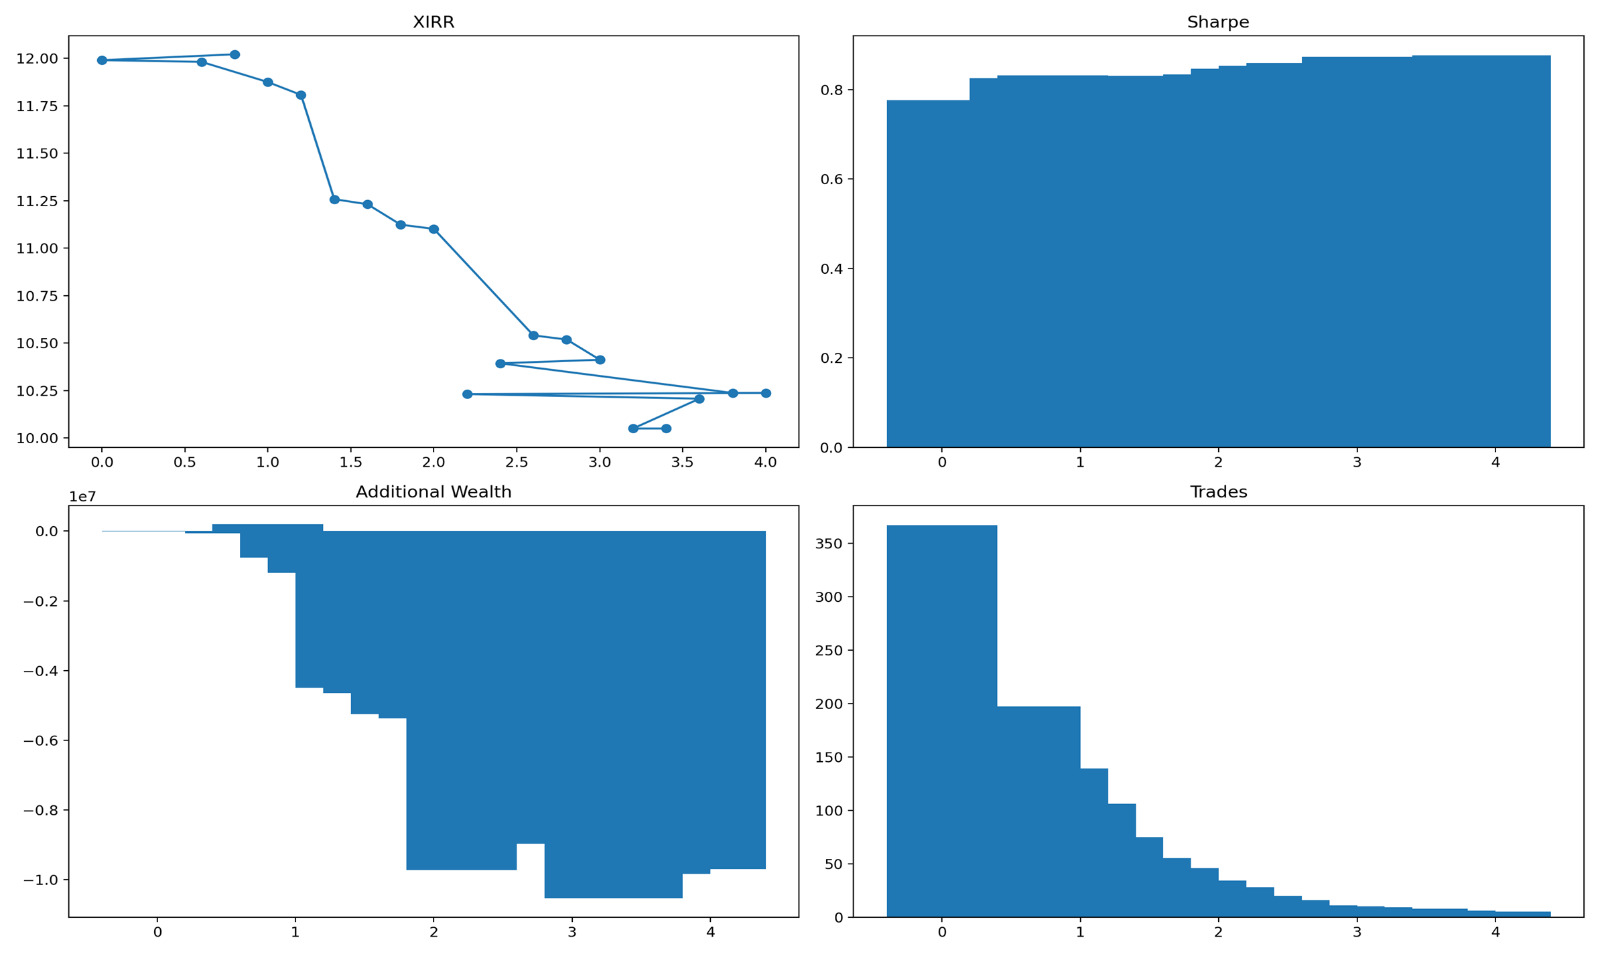
Intraday breakout outperforms at three thresholds, 0.6%, 0.8% and 1.0%. Overnight gap-up outperforms at exactly one, 0.8%.
| Signal | Threshold | Alpha | Additional wealth | Trades |
|---|---|---|---|---|
| Overnight gap-up | 0.8% | +0.030% | ₹1.97 lakh | 139 |
| Intraday breakout | 0.8% | +0.006% | ₹40,210 | 355 |
| Intraday breakout | 1.0% | +0.005% | ₹33,521 | 336 |
| Intraday breakout | 0.6% | +0.003% | ₹17,467 | 364 |
Dashboard: intraday breakout (Strategy 2), all nineteen thresholds.
All four sit in a band between 0.6% and 1.0%: tight enough to filter ordinary noise, but not so tight that the signal selects only the rare event-driven moves that tend to reverse. MOIC for the best case, the 0.8% gap-up, is 8.9478x against the benchmark's 8.8941x.
The band is narrower than the table suggests. The breakout signal sits directly beside its own cliff: at 1.2%, alpha turns negative at −0.008% and the strategy trails by ₹53,473. Gap-up has no margin at all. At 1.0%, one step above its only winning threshold, it already trails by ₹7.61 lakh, and at 1.4% its XIRR falls from 11.81% to 11.26% in a single step while the shortfall widens from ₹11.95 lakh to ₹44.94 lakh.
What the threshold does
The threshold decides the outcome in this grid, and its effect is not smooth in either sweep.
For breakout, results sit almost exactly on the benchmark at 0%, trailing by ₹1,672, move into the positive band between 0.6% and 1.0%, reverse at 1.2% and then decay. By the 3.0% level, ₹7.17 lakh sits idle in the bank earning 5% while the index compounds near 12%. The worst case, at 3.8%, trails by ₹12.96 lakh.
For gap-up the shape is sharper. There is one winning threshold, 0.8%, with underperformance on both sides of it: ₹65,168 behind at 0.6% and ₹7.61 lakh behind at 1.0%. Even the 0% setting, with 367 trades, trails by ₹7,400. Past 1.0% the losses deepen in two cliffs, the first at 1.4% and the second at 2.2%, where the shortfall jumps from ₹53.66 lakh to ₹97.20 lakh. The worst result, ₹1.05 crore behind, comes at 3.2% and 3.4%, which land on identical figures (10.05% XIRR) because both are pricing the same handful of historically unusual days. From 3.0% upward, only five to nine trades fire across the whole thirty-year period.
Dashboard: overnight gap-up (Strategy 4), all nineteen thresholds.
No threshold beyond the winning band is usable in either sweep. The penalty widens quickly past the band and then settles at a heavy level: between ₹9.88 lakh and ₹12.96 lakh behind for breakout from 3.0% upward, and between ₹82.65 lakh and ₹1.05 crore behind for gap-up from 2.2% upward.
Where it fails
Four winners out of 38 compares well with the equivalent weakness signals, none of which beat the SIP in 38 tests, and the difference has a structural explanation: an intraday breakout often reflects momentum that carries into the next session, and the 0.6% to 1.0% band filters noise without selecting only the spikes that then reverse. The direction of the result is defensible.
The magnitude is not. At best, the strategy adds ₹1.97 lakh against a benchmark that itself gained roughly ₹2.9 crore on the same contributions, an edge of about 0.7% of that gain and 0.03 percentage points a year in XIRR. Against that, the gap-up's worst case gives up ₹1.05 crore and the breakout's worst case ₹12.96 lakh. The payoff is heavily asymmetric, and the distance between the best threshold and a losing one is a single 0.2 percentage-point step.
That is the real objection. Acting on this result requires picking the exact threshold in advance, out of nineteen, with a losing setting immediately on either side, in exchange for an edge of 0.03 percentage points a year before slippage, which the study does not model.
Verdict
Buying strength beat buying weakness on Nifty at daily resolution over this window, the first positive finding in the deployment-timing series, and it is worth recording as such. It is not worth building around. Four of 38 thresholds produced positive alpha, the best adding ₹1.97 lakh across thirty years on ₹36.7 lakh contributed, while the worst threshold in the same grid trailed by ₹1.05 crore. An edge that depends on knowing the exact threshold in advance, with a losing setting one step away on either side, is not one a live implementer can rely on. On this evidence the plain SIP remains the better rule.
Appendix: assumptions and methodology
- Data. Nifty 50 daily open, high, low and close over a period exceeding thirty years, price return only. These are the platform's Strategy 2 and Strategy 4.
- Benchmark. Monthly SIP, ₹10,000 on the first trading day of each month, 0.03% cost, no bank and no signal: 11.9907% XIRR, a total gain of roughly ₹2.9 crore on ₹36.7 lakh contributed.
- Bank. ₹10,000 credited monthly, compounding at 5% annualised until a signal triggers full deployment.
- Tax. None modelled, and none applies. Units are bought and held permanently, so no gain is ever realised.
- Signal definitions. Overnight gap-up fires when that day's open minus the prior close, divided by the prior close, reaches the threshold, executed at that same open. Intraday breakout fires when the day's high minus the day's open, divided by the open, reaches the threshold, executed at the next day's open.
- Thresholds. 0.0%, then 0.6% to 4.0% in 0.2% steps, nineteen levels per signal. The 0.2% and 0.4% levels are not tested.
- Metrics. XIRR and alpha against the SIP. MOIC is given for the best gap-up variant only, 8.9478x against 8.8941x.
- Not modelled. Year-by-year returns, split-period figures, brokerage beyond 0.03%, slippage, securities transaction tax, dividend reinvestment. None of these appear in the source workbooks, and with an edge this thin, any of the first three could close it.
- Not tested. A Nifty 500 version of either signal, and any out-of-sample split that would show whether the 0.6% to 1.0% band holds in the second half of the window.
- Withheld. Nothing. The winning thresholds are printed above in full, because the conclusion of this study is that they should not be used, and a result that small is not worth protecting.
Comments
Questions and notes