Lineage: The earliest and broadest study in the deployment-timing series, run under a rounded 12.04% SIP benchmark that no later study uses.
The premise
Most investors have had this thought. The market falls, and buying into that fall should secure cheaper units and better compounding than investing the same money mechanically every month. The proposition is testable, and the point of running it 152 ways is to remove the objection that a single badly chosen threshold produced the answer.
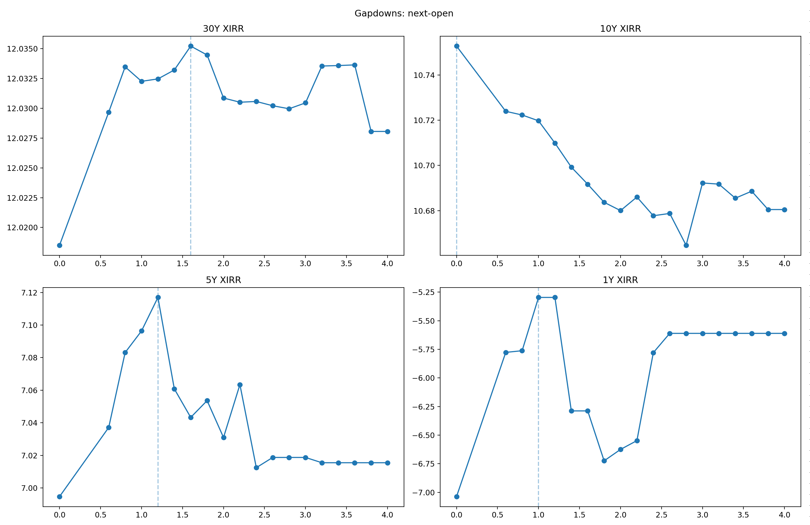
Weakness is measured two ways. Intraday drawdown measures how far the price fell during the session, from the prior close or that day's open down to the day's low. Because that distance is only known after the close, execution happens the following morning. Overnight gap-down measures how far the market opened below the prior close, which is visible at the open, so execution happens at that same open.
How the strategy works
Each signal is measured against two reference points, the prior close and the current open, which produce slightly different XIRR figures on near-identical trade counts. Each is then swept across nineteen thresholds, from 0.0% to 4.0% in 0.2% steps, and run under two deployment rules.
Under the pure-signal rule, money waits in the bank until a qualifying fall appears, however long that takes. Under the month-end fallback rule, the bank deploys at the last trading day's close if no signal has fired that month, which guarantees the capital is invested within thirty days regardless of what the market does. The difference between the two is the whole subject of this study, because it separates the timing decision from the delay that decision causes.
The setup
A bank account receives ₹10,000 on the first trading day of each month, compounding at 5% annualised on actual calendar days. When a signal clears its threshold, the full bank balance deploys into Nifty at a 0.03% transaction cost. Every unit bought is held permanently. There is no selling, no rebalancing and no capital gains tax anywhere in this test.
The benchmark is a capital-matched monthly SIP: ₹10,000 on the first trading day of each month, the same 0.03% cost, no bank and no timing. Across roughly thirty years of Nifty 50 daily data it returned 12.04% XIRR and turned ₹36.1 lakh of contributions into ₹3.11 crore.
The closest any combination came
There is no winner in this grid, so the useful table is not a leaderboard but the smallest gap to the SIP under each deployment rule.
| Combination | Deployment rule | Trailing the SIP by | Trades |
|---|---|---|---|
| Drawdown close, 0% threshold | Pure signal | ₹49,000 | about 361 |
| Gap-down close, 0% threshold | Pure signal | ₹1.28 lakh | 361 |
| Gap-down close, 4.0% threshold | Month-end fallback | ₹67,028 | 361, of which 4 from the signal |
| Drawdown close, 1.2% threshold | Month-end fallback | ₹2.48 lakh | 360 |
Dashboard: overnight gap-down, close variant, with month-end fallback.
What these four share is structural rather than strategic. Each one fires or falls back often enough that it ends up buying on approximately the benchmark's own schedule. A 0% threshold triggers on any fall at all, which is most days, so the strategy collapses to roughly one deployment a month and becomes a SIP wearing a signal. The 4.0% fallback case is the sharpest illustration: the gap-down signal fired four times in thirty years, and 356 of the 361 deployments came from the fallback rule rather than from any timing judgment. Proximity to the benchmark here measures how little timing is left, not how well the timing worked.
What the threshold does
Threshold is the only parameter with real influence, and it runs in one direction. Greater selectivity produces worse outcomes across the entire sweep.
For intraday drawdown the decay is gradual. Trade counts fall from 361 at a 0% threshold to 65 at 4.0%, and the worst shortfall peaks near ₹4.2 lakh at the 2.6% level. For gap-down the decay is not gradual at all. Between the 0.6% and 0.8% thresholds, a single 0.2% step, XIRR falls from roughly 11.96% to 11.19% and the wealth gap widens from ₹4.95 lakh to ₹48.2 lakh.
No threshold anywhere in the sweep produces a winner under the pure-signal rule. Every one of the nineteen levels is disqualified on its own figures.
Where it fails
The gap-down cliff at 0.8% is the most informative single reading in the grid. Gaps of that size follow genuine shocks rather than noise: geopolitical events, policy moves, broad sell-offs. Buying into those opens does not capture a discount, it captures the beginning of a drawdown, and the gap-down rule executes at that same open with no buffer day between signal and trade. At the 3.8% and 4.0% thresholds under the pure-signal rule, both variants converge on the same four trades and the same outcome: 8.65% XIRR, trailing the SIP by ₹1.51 crore, which is more than four times the total capital contributed. Searching for a better threshold does not help, because the failure lies in what the signal selects for.
The fallback rule does not repair this. It conceals it. At every threshold the fallback version still trails the benchmark, but by less, because most of its trades no longer originate with the signal. In the 4.0% case, 356 of 361 deployments are fallback trades, and the remaining 1.1% that did come from the timing signal made the result worse rather than better. Compressing the worst shortfall from ₹1.51 crore to ₹67,028 is a 99.9% improvement achieved by removing almost all of the strategy.
Idle capital is the mechanism underneath both failures. Under the pure-signal rule at a 4.0% threshold, up to ₹2.41 lakh sits in the bank earning 5% while the index compounds at roughly 12%. Every month of waiting is charged at that seven-point spread, and no entry price obtained later recovers it.
Verdict
None of the 152 combinations beat a plain monthly SIP over this window. The two signals fail for different reasons, which is worth separating: an intraday fall carries no information about the next morning's price, while a large overnight gap tends to precede further weakness rather than a bounce. The month-end fallback appears to fix the second problem and does not, because it works by replacing the timing decision with SIP-equivalent buying. On this data, over this window, a fall in the index is not a reason to expect a better entry. Run the SIP.
Appendix: assumptions and methodology
- Data. Nifty 50 daily open, high, low and close, approximately 1994 to 2024, a little over thirty years, price return only.
- Benchmark. Monthly SIP, ₹10,000 on the first trading day of each month, 0.03% cost, no bank and no signal: 12.04% XIRR, ₹3.11 crore final on ₹36.1 lakh contributed. This is a rounded figure, and later studies in the series use a recomputed 11.9907%, so figures here are not directly comparable to theirs.
- Bank. ₹10,000 credited monthly, compounding at 5% annualised on actual calendar days until a signal triggers full deployment.
- Tax. None modelled, and none applies. Units are bought and held permanently, so no gain is ever realised.
- Signal definitions. Drawdown fires when the fall from R to that day's low, divided by R, reaches the threshold, where R is the prior close for the close variant or that day's open for the open variant, executed at the next open. Gap-down fires when the prior close minus that day's open, divided by the same R, reaches the threshold, executed at that day's open.
- Grid. Two signals, two reference variants, nineteen thresholds from 0.0% to 4.0% in 0.2% steps, two deployment rules: 152 combinations.
- Month-end fallback. If no signal fires by the last trading day of the month, the full bank balance deploys at that close, same 0.03% cost.
- Not modelled. Brokerage beyond 0.03%, securities transaction tax, slippage, market impact, dividend reinvestment, dynamic position sizing.
- Not tested. A Nifty 500 version of this grid. Every figure above is Nifty 50 only.
- Withheld. Nothing. The signal definitions and the full threshold sweep are stated above, because a dip-timing rule has no configuration worth protecting once the conclusion is that none of them work.
- Source note. No surviving code or workbook reproduces this 152-combination grid. Every figure above is carried from the published article, and the closest candidate workbooks were checked and rejected. See the verification file.
Comments
Questions and notes